An
essential component of the ACE Arctic Validation Campaign are the
instruments which we are using to make our measurements. As you read
through our daily reports you might be wondering a little about what
we're talking about. Here are some of the stars of our show:
Fourier Transform Spectrometers
The
Fourier Transform Spectrometers (FTSs) being used during the Arctic
Campaign are all direct-sun, infrared absorption instruments. Sunlight
enters the instrument by way of a tracker mounted on the roof and
several mirrors inside the FTS lab. Once inside the instrument, the
light is split into two beams by a beam-splitter. A changing path
difference between the two beams is
introduced by the use of a moving mirror in one beam. The
constructive and destructive interference that results when the beams
are recombined is measured by a detector. This signal is
called an interferogram. A
mathematical transformation, the Fourier transform,
of the interferogram produces a spectrum, which is
essentially a 'fingerprint' of the atmosphere that the sunlight has
passed
through on its way to the instrument. Absorption features in the
spectrum are produced by specific molecules in the atmosphere,
providing information about the concentration and location of these
gases.
At
PEARL there are now two FTS instruments, each of slightly
different design and spectral resolution. They are capable of
measuring more than 15 different gases, including O3, NO2, NO, HNO3, N2O, CO, CH4, HCl, HF, CO2, COF2 and ClONO2.
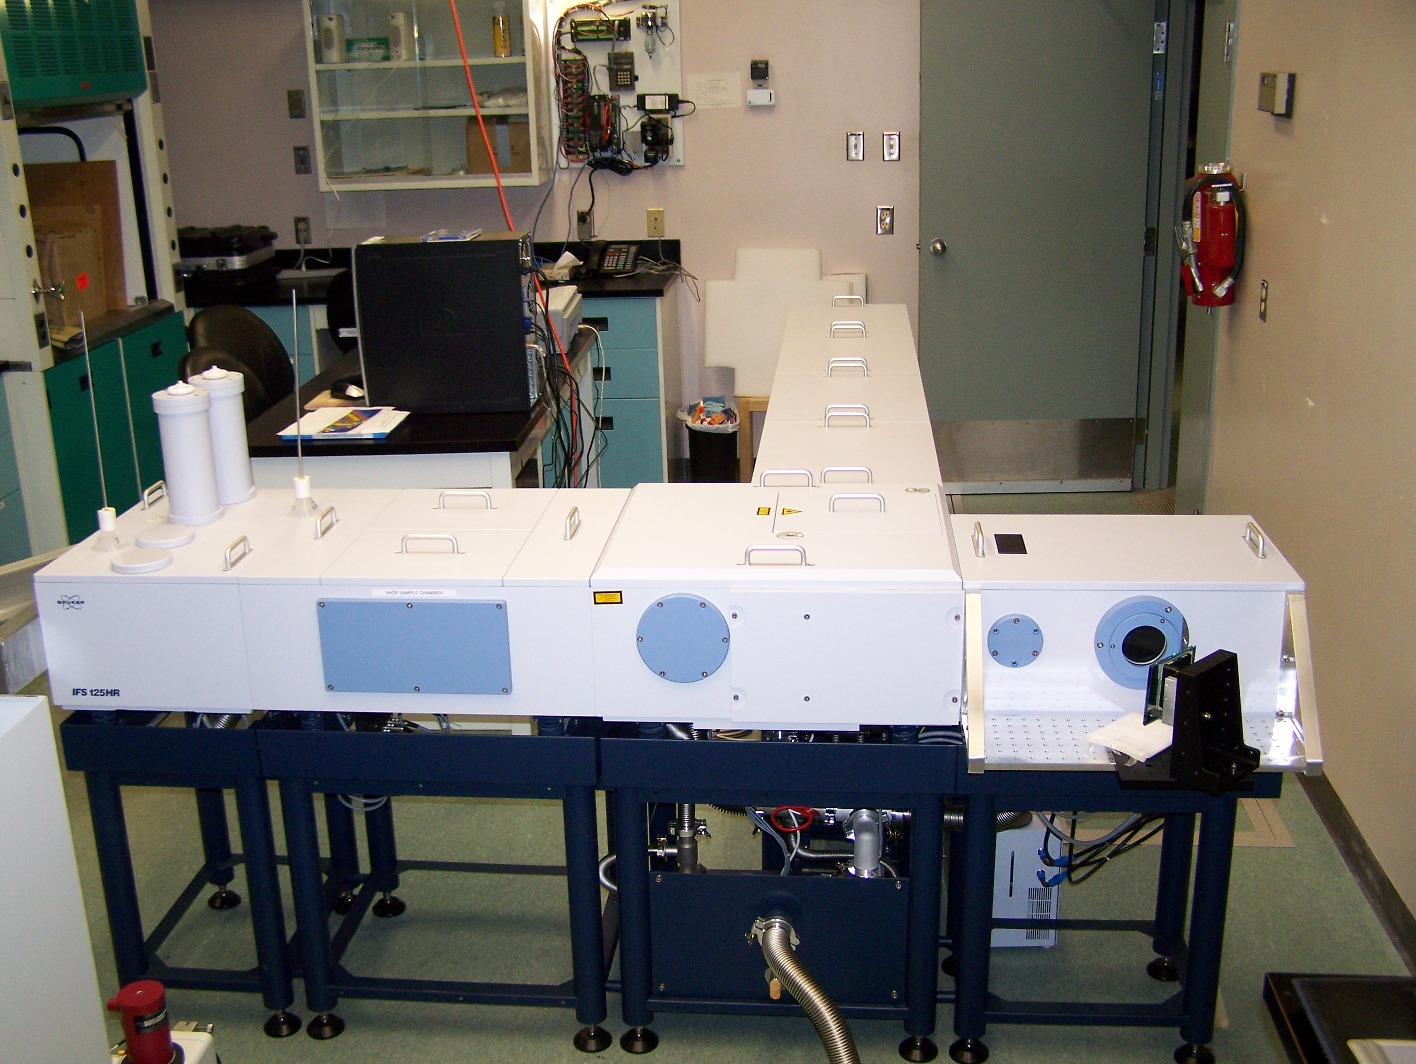
CANDAC Bruker IFS 125HR
The
Bruker IFS125HR is a permanent resident of PEARL. It was installed in July
2006, and is part of the CANDAC suite of instruments. It has very high resolution (0.0035cm-1) and, like the DA8, has two detectors - an InSb for the 1800-8500 cm-1 region and
an MCT for the 500-5000cm-1
region - which are cooled with liquid nitrogen. This is the
Bruker's third Arctic spring campaign. The Bruker operates year-round
(when the Sun is up), giving us a long-term dataset to
help us to better understand the composition and changes occurring in
the Arctic atmosphere.
Bruker IFS 125 HR (left) in the PEARL FTS lab. Photo by R. Lindemaier
University of Waterloo PARIS-IR
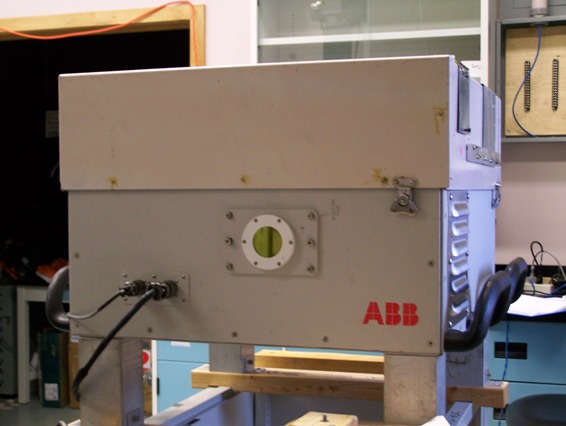 The
Portable Atmospheric Research Interferometric Spectrometer for the
Infrared (PARIS-IR) is a terrestrial version of the ACE-FTS, the
high-resolution FTS on board SCISAT-1 (http://www.ace.uwaterloo.ca).
It is small and portable compared to the other FTS instruments,
and is only at Eureka during the ACE validation campaign each spring.
Like the other FTSs, PARIS-IR uses infrared radiation from the Sun to
measure absorption spectra of the gases in the Earth's
atmosphere. While PARIS-IR has a lower resolution (of 0.02 cm-1) than the other FTSs, each spectrum measured by PARIS-IR covers the full spectral range (750 - 4400 cm-1).
This allows changes in the concentrations of all of the trace gases to
be measured simultaneously throughout the day.
PARIS-IR in the PEARL FTS lab. Photo by A. Harrett
UV-Vis spectrometers
As their name implies, UV-Vis spectrometers are instruments which
directly collect spectra in the UV and visible regions of the electromagnetic
spectrum. UV-Vis spectrometers use a grating to split light into spectra
(much as a prism divides white light into a 'rainbow'), which
are recorded directly by the detector and electronics. For this campaign there is a
suite of UV-Vis instruments, each recording over a similar wavelength
region, but with differing resolution.
UT-GBS and PEARL-GBS
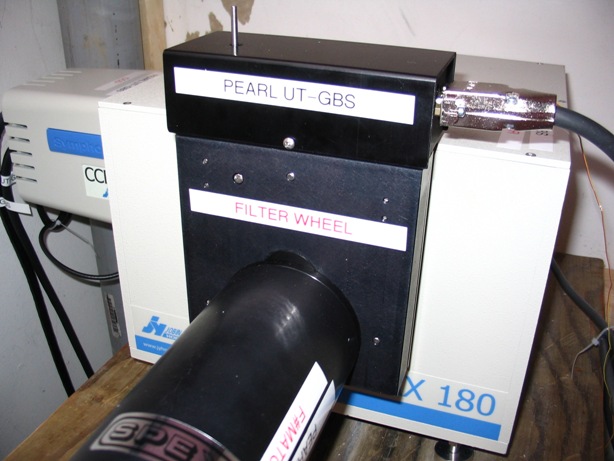 PEARL-GBS. Photo by A. Fraser
During the campaign, there will be two University of Toronto ground-based
instruments in operation at PEARL. These are zenith-sky (looking
straight up) UV-Visible spectrometers which measure stratospheric trace gases
from the ground using a well-established method of retrieval called Differential Optical Absorption Spectroscopy (DOAS) to determine vertical columns of
ozone and NO2, and slant column densities of BrO and OClO. One of these instruments, the UT-GBS, records
zenith scattered sunlight spectra. This is now its tenth deployment to Eureka, for polar sunrise between 1999 and 2009. The other
instrument, the PEARL-GBS, was installed permanently in Eureka
in August 2006 for year-round
operation, and will record direct-sun spectra, using a new sun-tracker
developed at the University of Toronto. With two instruments
working
together, one in zenith mode and one in direct-sun mode, information on
the
vertical distribution and diurnal variation of BrO can be retrieved
using an
optimal estimation method.
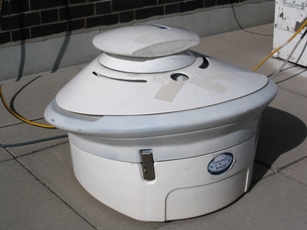 SAOZ
SAOZ
SAOZ (Systeme d'Analyse par
Observation Zenithale) is an automated, zenith-sky-viewing UV-Visible
spectrometer on loan from Service d'Aeronomie, CNRS
(France), for the ACE Validation Campaign. SAOZ instruments are
widely used around the world, and are specifically designed for making
stratospheric column measurements in polar regions. SAOZ measurements are made in
the 300-600 nm wavelength range with a resolution of about 0.8 nm,
primarily at solar zenith angles greater than 81
degrees. The DOAS method is used for retrieving
stratospheric gas column amounts of O3 and NO2 in a similar way to the UT-GBS systems.
SAOZ. Photo by A. Fraser
SPS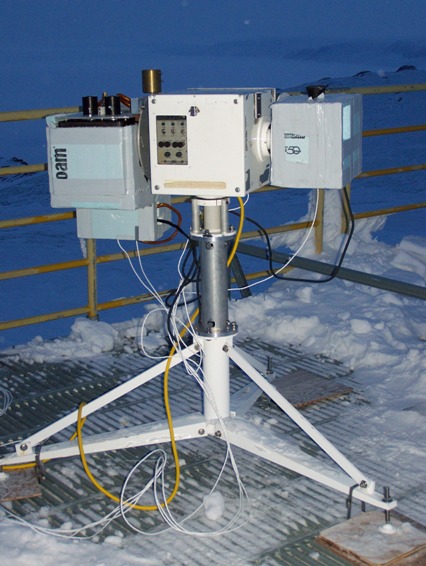
SPS (Sun Photo Spectrometer) is a light-weight, compact, photodiode array
spectrophotometer. It has a holographic diffraction grating which
focuses the spectra, in the range of 290-775 nm in two orders, onto a
detector. It has a spectral resolution of approximately 1.2 nm in the second order and 2.5 nm in the first order. A
double filter-wheel assembly inside the instrument allows a selection of
filter combinations for different purposes, including order selection
and polarizing filters. The SPS has flown on the Space Shuttle and several ER-2 aircraft campaigns, and is a
temporary visitor at Eureka for the spring campaigns. Here its primary
focus is measurements of atmospheric NO2 and O3 concentrations. It can also measure sky brightness and aerosols.
MAESTRO (left) and SPS (right) on the roof of PEARL. Photo by T. Kerzenmacher
MAESTRO-G
MAESTRO-G
(Measurement of Aerosol Extinction in the Stratosphere and Troposphere
Retrieved by Occultation) is the ground-based equivalent of
ACE-MAESTRO, which is currently flying on the ACE satellite.
It is composed of two independent diode-array spectrometers measuring
in the UV-Visible (285-565 nm) and the visible-near-infrared (515 -1015
nm) spectral regions, each with a resolution of approximately 2 nm.
Each spectrometer consists of a lens, slit, concave holographic grating
and a photodiode array detector. It can measure various atmospheric constituents,
including O3, NO2, BrO, NO3, and aerosols.
MAESTRO-G is mounted on one side of a solar
tracker (the left, in the picture), and the SPS is mounted on the other.
Measurements are made in zenith sky mode (pointing straight up) most of
the time, but for a short period during each degree of zenith angle
the instruments make measurements while pointed directly at the sun. This is
important for the process used to retrieve gas amounts from the
recorded spectra.
 The Brewer Spectrophotometer
The
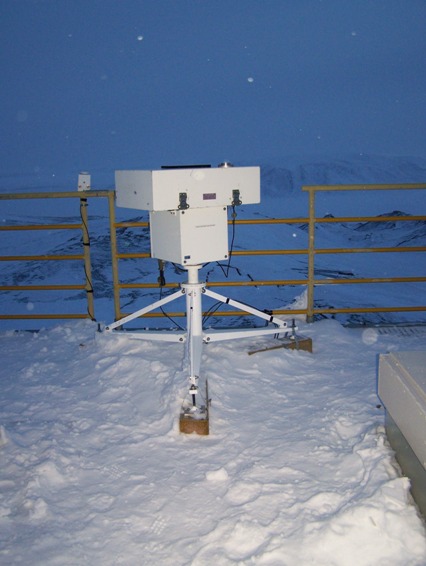
Brewer spectrophotometer is an internationally recognized WMO standard
instrument for the measurement of ozone. In simple terms, it uses the
fact that ozone has a large difference in its absorption strength at
different wavelengths to determine the amount of ozone in the
atmosphere between the instrument and the sun. Unlike the older, manual
Dobson instrument,
which uses prisms to break the light into spectra, the Brewer uses a
holographic grating and is completely automated.
There are three Brewer spectrophotometers in operation at Eureka - one
at PEARL and two at the weather station. The three instruments are all
different models with slightly different gratings and operating in
different orders (which gives them different wavelength regions to look
in). As well as ozone data, NO2 can be determined. The data from these instruments goes into the world-wide network to monitor ozone change.
Brewer Spectrophotomer, Photo T. Kerzenmacher
Ozone Profiling Instruments
The DIAL LIDAR
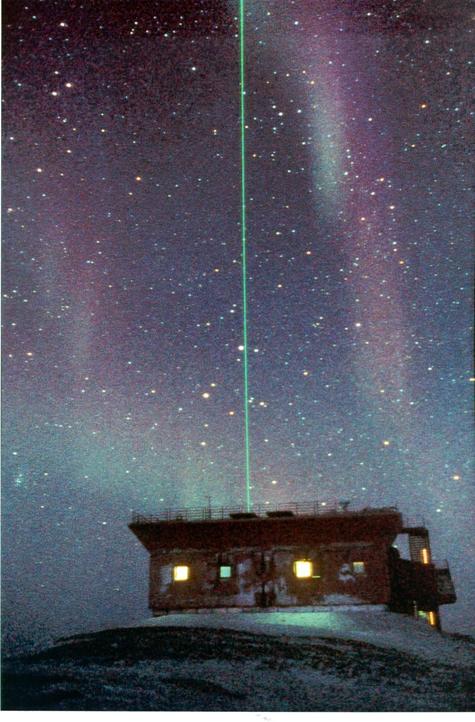
A LIDAR (LIght Detection and Ranging) is an instrument that uses
laser light to detect particles and gases in the atmosphere. Light
pulses are sent into the atmosphere where they
are scattered back by aerosol particles and air molecules and absorbed
by atmospheric constituents. The returned light is captured in
a telescope, and is used to study the location and nature of particles
and molecules in the atmosphere. Environment Canada has had a DIfferential Absorption LIDAR (DIAL)
at Eureka since 1993. DIAL is a special type of lidar
that uses more than one wavelength to detect differences in absorption.
For example, by studying the difference in absorption at wavelengths
where ozone
absorbs strongly and weakly, a very accurate profile of the ozone
distribution can be obtained. Because the returned light is very weak
(it
is being scattered back from very high altitudes by molecules and
particles), the DIAL operates only at
night when the background light is less intense. In addition to
measuring ozone, DIAL measurements can also produce temperature
profiles.
DIAL LIDAR over PEARL, Courtesy T. Nagai
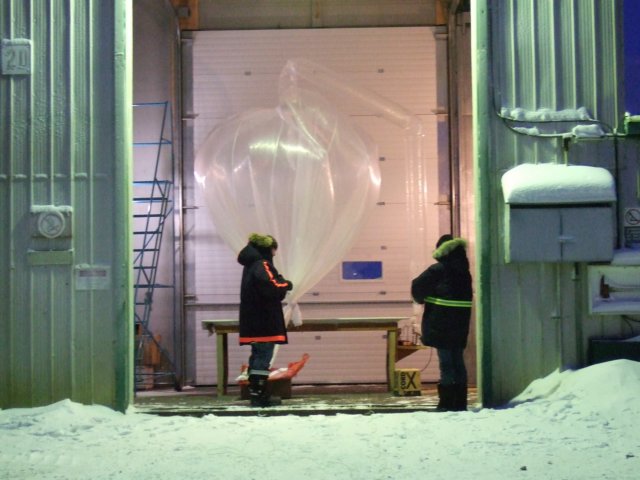
Balloon filling for an ozonesonde launch. Photo by T. Kerzenmacher
 Ozonesondes
Unlike the other campaign instruments, which measure remotely (either
from the ground
or a satellite), an ozonesonde actually travels through the atmosphere
measuring the local concentration of ozone. To do this, the instrument
catches a ride on a hydrogen-filled balloon which rises up through
the atmosphere (just
like those helium filled ones you had as a kid - but a lot bigger!) The
instrument itself is a small chemical cell. Air is sucked into one
chamber of the cell. Ozone in the air sample reacts with the chemical,
causing a current to flow. The concentration of ozone is determined
from the measured current.
The ozone amount, along with temperature, pressure and humidity
information that are also measured along the way, is transmitted back
to
earth as the balloon goes up, using a radio signal. The
ozonesonde
gives us a very high-precision profile of the ozone through the part of
the atmosphere that it measures. As you can imagine, this is very
useful for helping verify the data that we get with the other
instruments. Unfortunately, because ozonesondes are expensive (those
balloons get to as big as a hockey arena by the time they pop at
around 30km!), measurements are not made as frequently
as with the other instruments. Thus, an important part of
this campaign is the daily launch of ozonesondes during the
campaign's intensive phase.


 PEARL-GBS. Photo by A. Fraser
 SAOZ
SAOZ
 The Brewer Spectrophotometer
 Ozonesondes